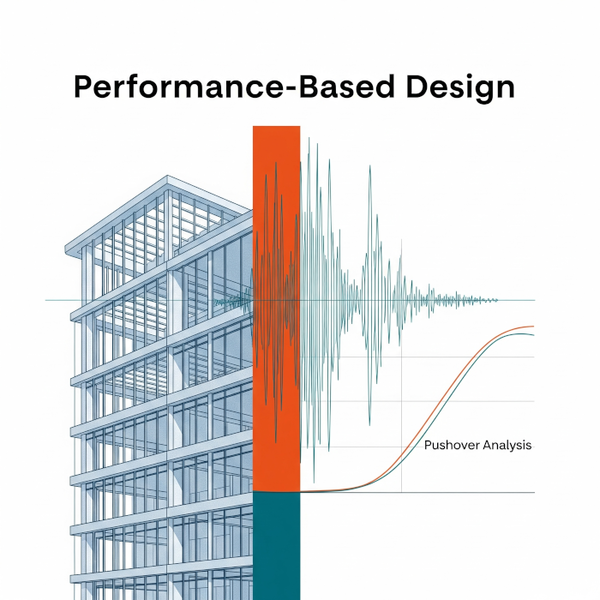
In our first two posts on Performance-Based Design (PBD), we covered the “what and why” – shifting from prescriptive codes to targeting specific building performance – and then we looked at the “who and how” of setting those crucial performance objectives. If you missed them, I’d suggest giving them a read first as we’re about to jump into the deep end of the pool.
So, you’ve defined your performance objectives, maybe something like “Immediate Occupancy” for a moderate quake and “Life Safety” for that big one the NBCC makes us think about. Now what? How do you actually prove your design will hit those targets? This, my friends, is where the real engineering magic (and a fair bit of number crunching) happens. Today, we’re rolling up our sleeves and getting into the technical toolkit: analysis methods, modeling secrets, and the all-important verification process.
Defining the Shake
Before we even think about analyzing our building, we need to define the earthquake itself. It’s not just about picking a number from a code table when you’re doing serious PBD.
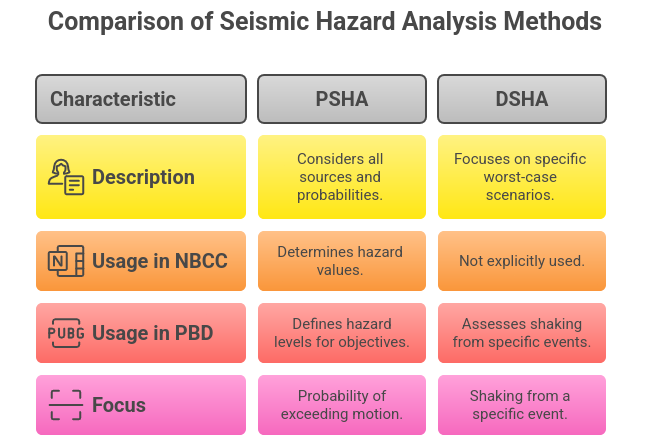
Seismic Hazard Analysis: PSHA vs. DSHA
You’ll often hear two main acronyms tossed around:
- Probabilistic Seismic Hazard Analysis (PSHA): This is the workhorse behind the seismic hazard values in the National Building Code of Canada (NBCC). It considers all known seismic sources, their magnitudes, and recurrence rates to give you the probability of exceeding a certain ground motion level at your site over a period. Think of the NBCC’s 2% in 50-year hazard level – that comes from PSHA. For PBD, you might need PSHA for multiple return periods to define different hazard levels for your performance objectives (e.g., a 10% in 50-year event for an “Operational” check).
- Deterministic Seismic Hazard Analysis (DSHA): This approach looks at a specific, often “worst-case credible,” earthquake scenario on a particular fault. For instance, if you’re near a known active fault here in BC, DSHA can tell you what kind of shaking to expect if that fault decides to have a bad day. It’s less about probability and more about the “what if” for a specific event.
Pro-Tip: For most PBD projects in Canada, you’ll start with the PSHA results, often using data from the Geological Survey of Canada (GSC) which underpins the NBCC. Site-specific PSHA can refine this further, especially for critical projects.
Ground Motion Selection & Scaling
If you’re heading down the path of Nonlinear Time History Analysis (and for robust PBD, you often are), you can’t just use a design response spectrum. You need actual earthquake records.
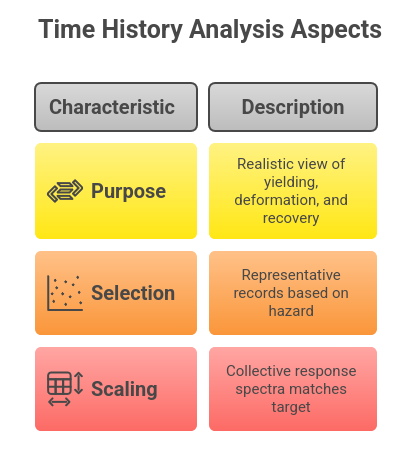
- Why? Time history analysis applies the ground shaking second by second to your model, giving you a much more realistic view of how things yield, deform, and recover (or don’t!).
- Selection: It’s not just picking random earthquakes. You need a suite of records (NBCC Commentary usually suggests 7 to 11 pairs of horizontal motions) that are representative of your site’s hazard in terms of:
- Magnitude
- Distance from the source
- Faulting mechanism (important for us in BC with the Cascadia Subduction Zone!)
- Local site conditions (soil class)
- Scaling: Once selected, these records need to be scaled so their collective response spectra “envelope” or match your target PSHA spectrum for the hazard level you’re assessing. The NBCC Commentary (Clause C-28 in the 2020 version is a good starting point) provides guidance on this.
Key Takeaway: Garbage in, garbage out! The quality of your ground motion selection and scaling directly impacts the reliability of your time history analysis results. Don’t skimp here.
Key Considerations for Your Structural Model
Now that you know what you’re hitting it with, what about the model itself? For PBD, a linear elastic model often won’t cut it. We need to capture what happens when things start to bend, crack, and yield.
Material Nonlinearity
This is where your model starts to get really smart.
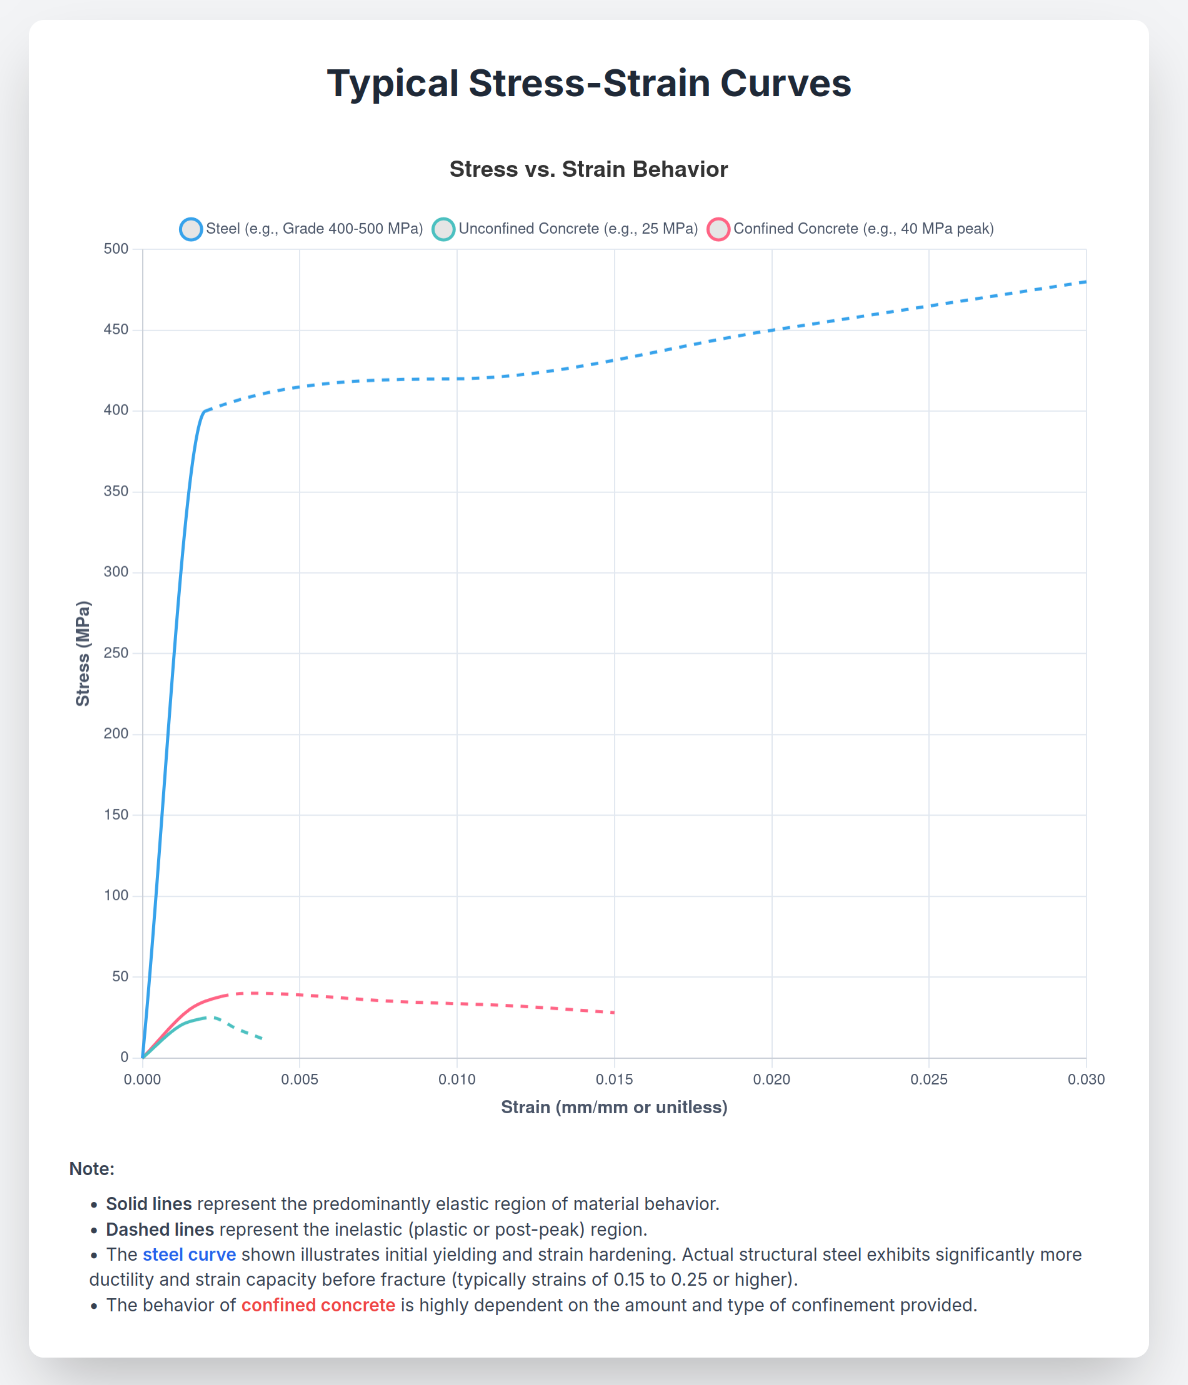
- Steel: You need to define its yield strength, yes, but also its strain-hardening properties. How does it behave after it yields? Think about those plastic hinge regions. CSA S16 provides the backbone for material properties and expected behavior.
- Concrete: This is even more fun! You’re modeling compressive strength (including post-peak softening), tensile cracking, and the crucial role of confinement from hoops and ties in columns (thank you, CSA A23.3, for those details!).
- Reinforcing Steel: Again, yield, strain hardening, and how it behaves under repeated loads.
Geometric Nonlinearity
Ah, P-Delta. The effect where gravity loads acting on a displaced structure cause secondary moments. In tall or flexible structures, especially when they start to lean in an earthquake, P-Delta can be a game-changer, potentially reducing your lateral capacity or even leading to instability. Make sure your software is accounting for it.
Component Behavior
- Beams & Columns (Flexural Elements): Where will plastic hinges form? How much rotation can they sustain? Fiber models or concentrated plastic hinge models are common here.
- Braces: Tension yielding is one thing, but compressive buckling and post-buckling behavior are critical for steel braces.
- Shear Walls: Flexural yielding, shear behavior, coupling beam actions – lots to consider for our concrete shear walls. Accurate finite element meshing is critical here to capture the complex shear flow, especially around openings.
- Connections: Are they designed to be stronger than the members (capacity protected)? Or are they part of the energy dissipation system? Their behavior is key.
Pushover vs. Time History
So you’ve got your hazards and your fancy nonlinear model. How do you actually analyze it?
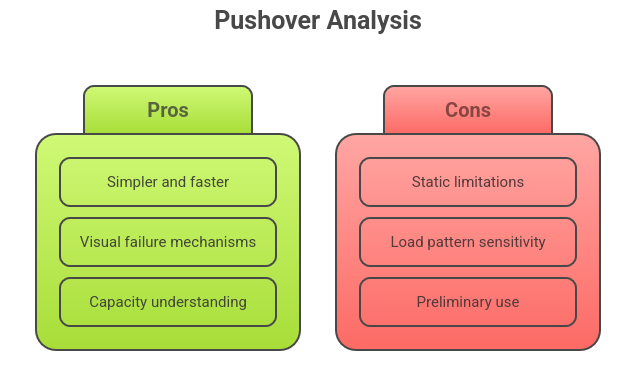
Nonlinear Static (Pushover) Analysis
- What it is: You apply a lateral load pattern to your model and “push” it incrementally, tracking how it deforms and where yielding occurs, until you reach a target displacement or a collapse mechanism.
- Pros:
- Simpler and faster than a full time history.
- Gives a great visual of failure mechanisms and the sequence of yielding.
- Good for understanding overall capacity.
- Cons:
- It’s static – doesn’t capture dynamic effects like higher modes or cyclic degradation.
- Results can be sensitive to the chosen load pattern.
- When to Use: Often used for preliminary assessments, for simpler structures, or as a way to understand the capacity side of the equation. ASCE 41 (Seismic Evaluation and Retrofit of Existing Buildings) relies heavily on it, and its principles are often adopted.
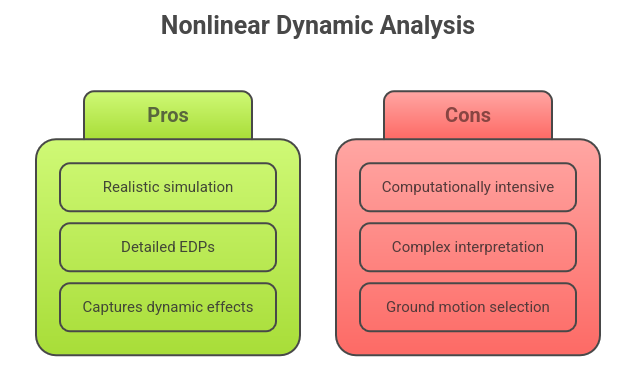
Nonlinear Dynamic (Time History) Analysis
- What it is: The gold standard for detailed PBD. You apply those selected and scaled ground motion records to the base of your nonlinear model and simulate its response through time.
- Pros:
- Most realistic simulation of earthquake response.
- Directly provides Engineering Demand Parameters (EDPs) like peak drifts, plastic rotations, and floor accelerations over time.
- Captures dynamic effects, cyclic loading, and damage accumulation.
- Cons:
- Computationally intensive and complex.
- Requires careful ground motion selection and scaling.
- Interpreting the sheer volume of output takes skill.
- When to Use: For important/complex structures, when required by code (NBCC has triggers for this, especially for tall buildings), or when you need high confidence in achieving specific performance objectives.
Crucial Clarification: For rigorous PBD aiming to verify specific inelastic performance (e.g., “Immediate Occupancy” based on plastic hinge rotations), standard linear Equivalent Lateral Force (ELF) or Response Spectrum Analysis (RSA) procedures are generally not sufficient on their own. They don’t directly model or quantify the inelastic demands. Pushover or Time History analyses are usually needed to get that level of insight.
The Moment of Truth
You’ve run your fancy analyses. Now what?
Engineering Demand Parameters (EDPs)
These are the specific outputs from your analysis – the vital signs of your building:
- Peak interstory drifts
- Plastic hinge rotations
- Material strains (concrete, rebar, steel)
- Floor accelerations/velocities
- Residual drifts (the permanent lean after the shaking stops – very important!)
Comparing Demands to Acceptance Criteria
This is where it all comes together. For each performance objective (which links a hazard level to a performance level), you have:
- Calculated EDPs (Demands) from your analysis.
- Acceptance Criteria (Capacities) for that performance level (e.g., allowable plastic rotation for IO from ASCE 41 or a similar PBD guideline).
You systematically compare them: Is Demand ≤ Capacity?
If yes for all relevant EDPs at all critical locations, congratulations! You’ve met that performance objective. If not…
The Iterative Cycle
It’s rare to nail it on the first try. If your demands exceed your capacities:
- Identify where the problems are.
- Modify your design (stiffer members, stronger connections, different system, etc.).
- Re-analyze your updated model.
- Re-verify against the acceptance criteria.
This loop continues until all your performance objectives are met. It’s what makes PBD a true design process.
The material here is deliberately detailed, but it should give you a much clearer picture of the analytical heavy lifting involved in PBD. It’s a step up from straightforward prescriptive design, and the ability to truly understand and target specific building performance is incredibly powerful, especially as we push for more resilient structures here in Canada.
For a broader look at how PBD fits into the current Canadian code landscape, Canadian Codes, Challenges, and the Road Ahead explores the policy, code, and practice implications in more detail.